
IHS Global
Project: Infographic design for IHS Markit
Client: IHS Markit (now part of S&P Global)
Location: Global
Description:
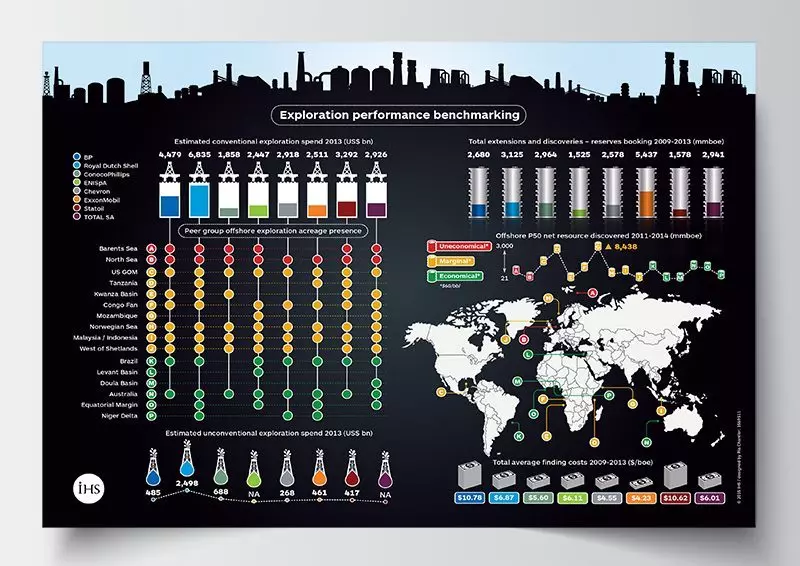
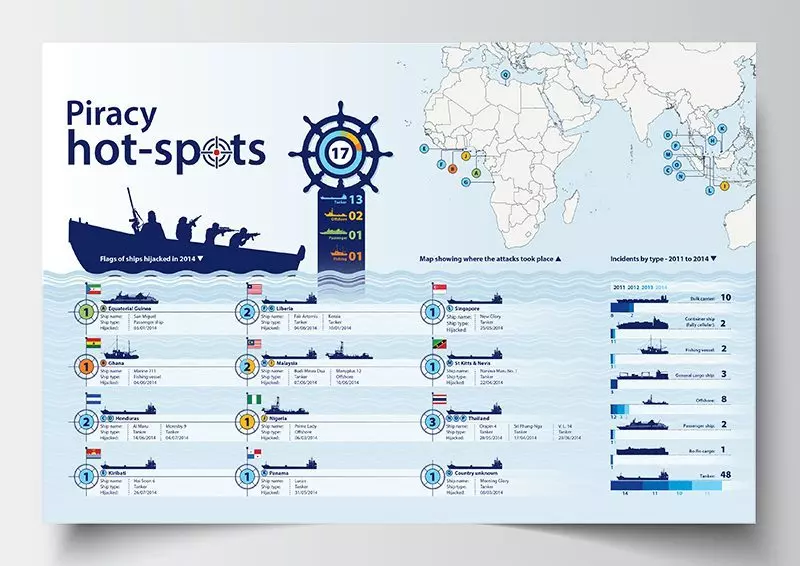
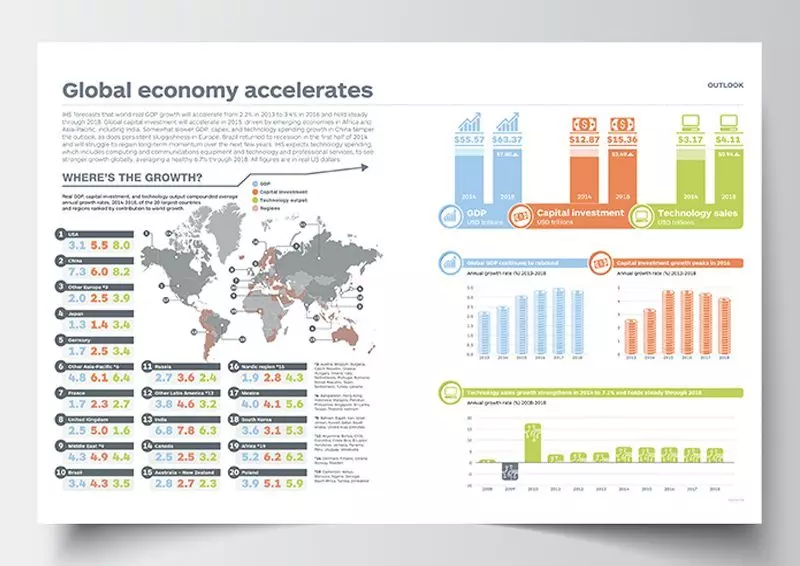
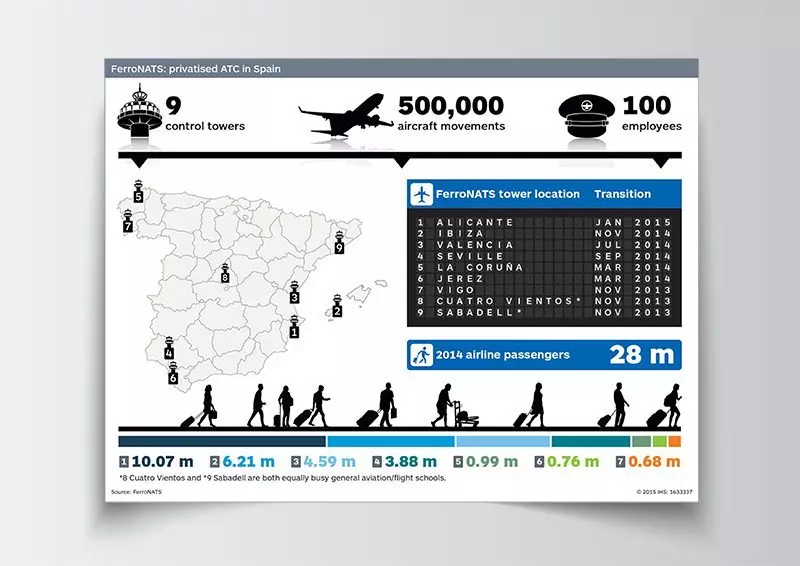
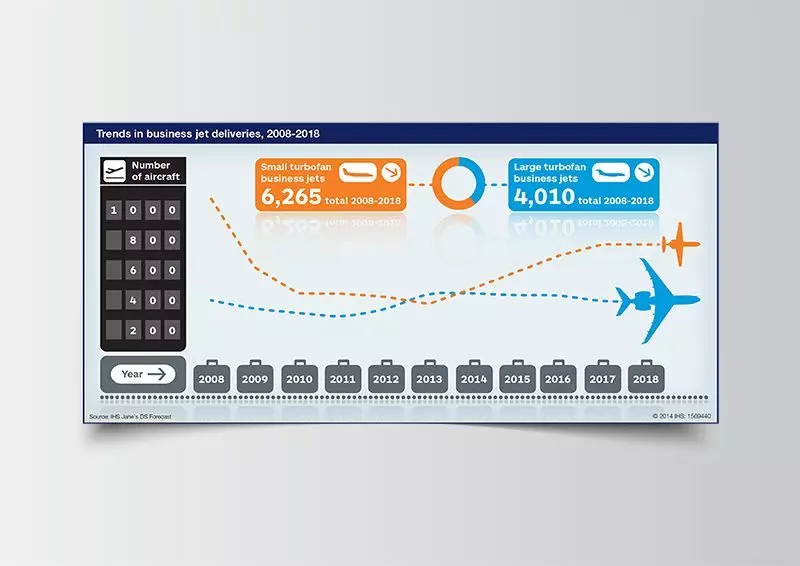
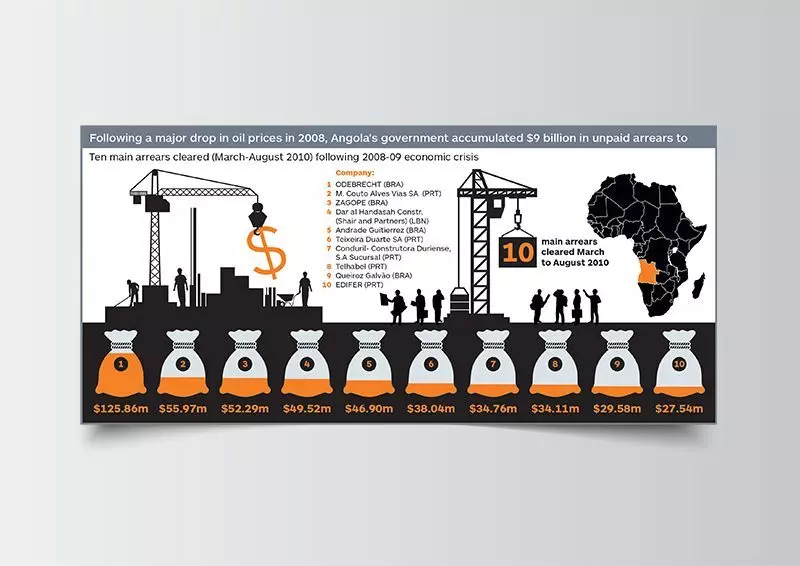
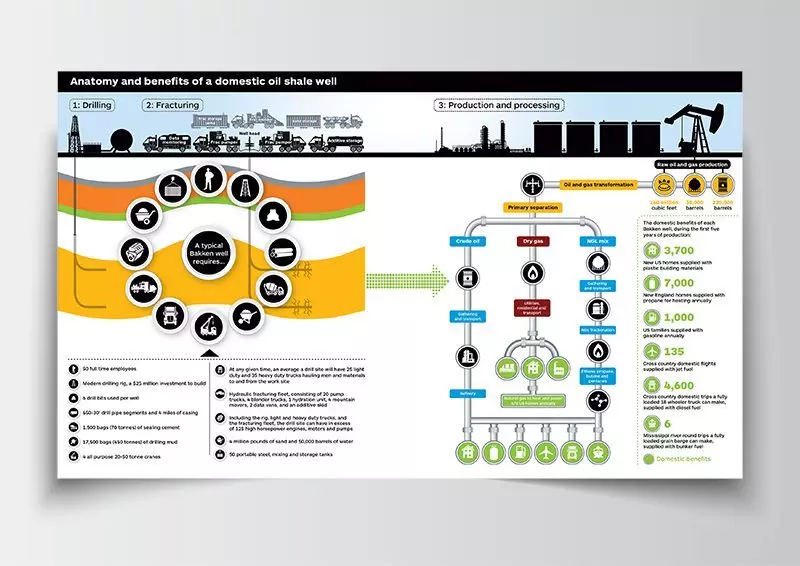
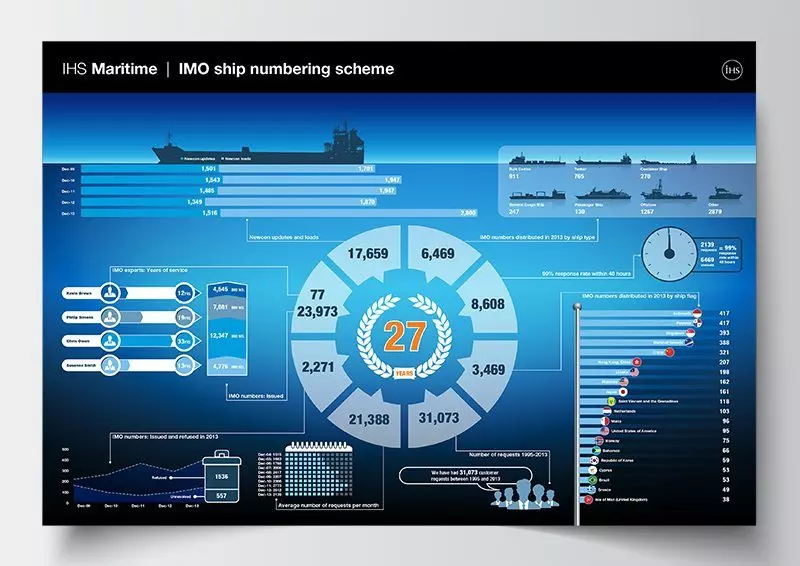
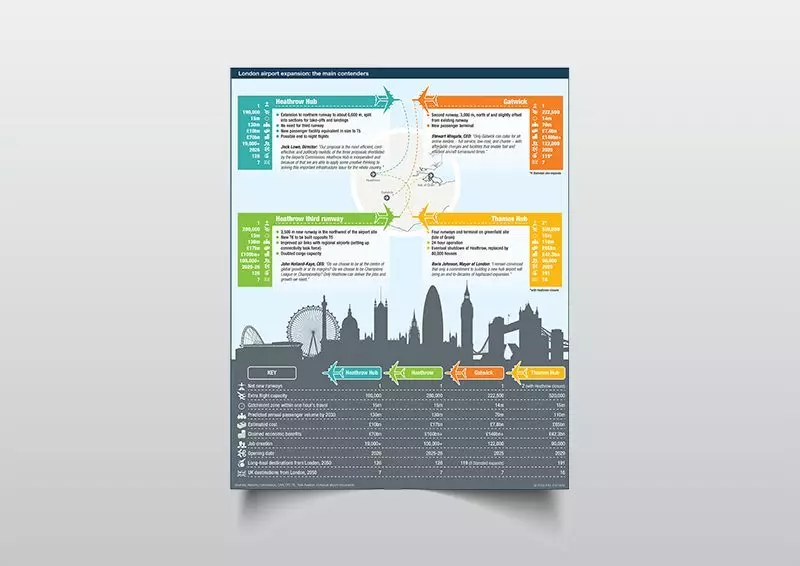
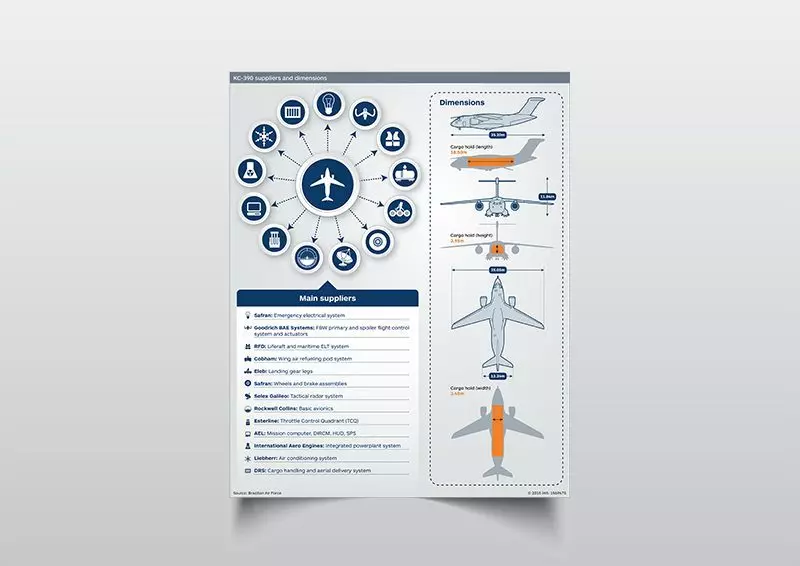
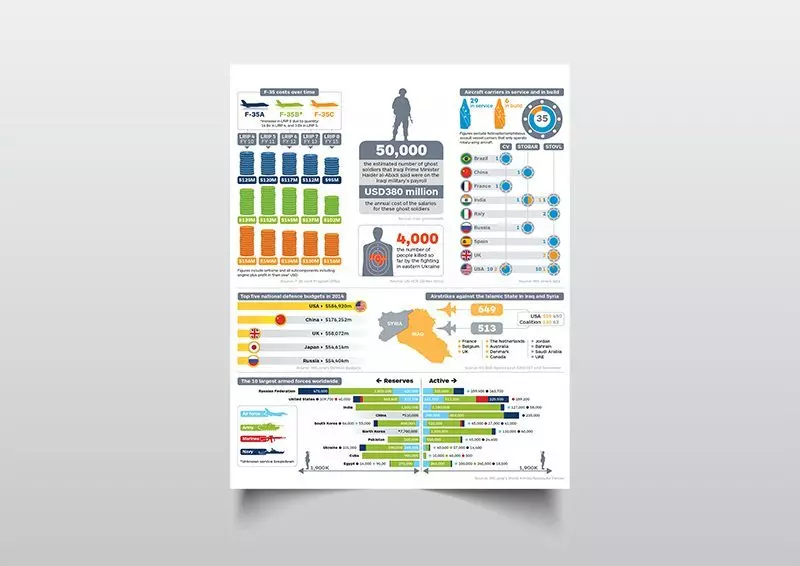
Working closely with IHS Markit as a senior designer, the focus is on producing high-impact infographics that illustrate intelligence across a broad range of capital-intensive industries and markets. By visually connecting data across key variables, these infographics help analysts and industry specialists present customers with a richer, highly integrated view of their world.
Designed to reflect IHS Markit’s theory of New Intelligence, these visuals isolate cause and effect, risk and opportunity in ways that empower customers to make well-informed decisions with greater confidence. The infographics showcase global expertise across multiple industries, including leading positions in finance, energy, and transportation, ensuring complex insights are accessible, engaging, and actionable.